Reported Turbulence
Aviation safety feature for Jeppeson ForeFlight
Role
Design Lead
Tools
Figma
Team
Product Manager, Engineer, Test Engineer
Problem
When flying on a bumpy day, a pilot might hear other pilots checking in with ATC to ask for reports of smoother altitudes from others on frequency. Avoiding turbulence is not always that simple though – even for the most experienced pilots. Planning a bump-free flight is a challenging and frequently unreliable process.
Typically, pilots rely on a combination of Pilot Reports (PIREPs), computer-generated forecast models, and winds aloft forecasts to anticipate air conditions. These methods each have limitations and using all three together doesn’t guarantee success either.
Research
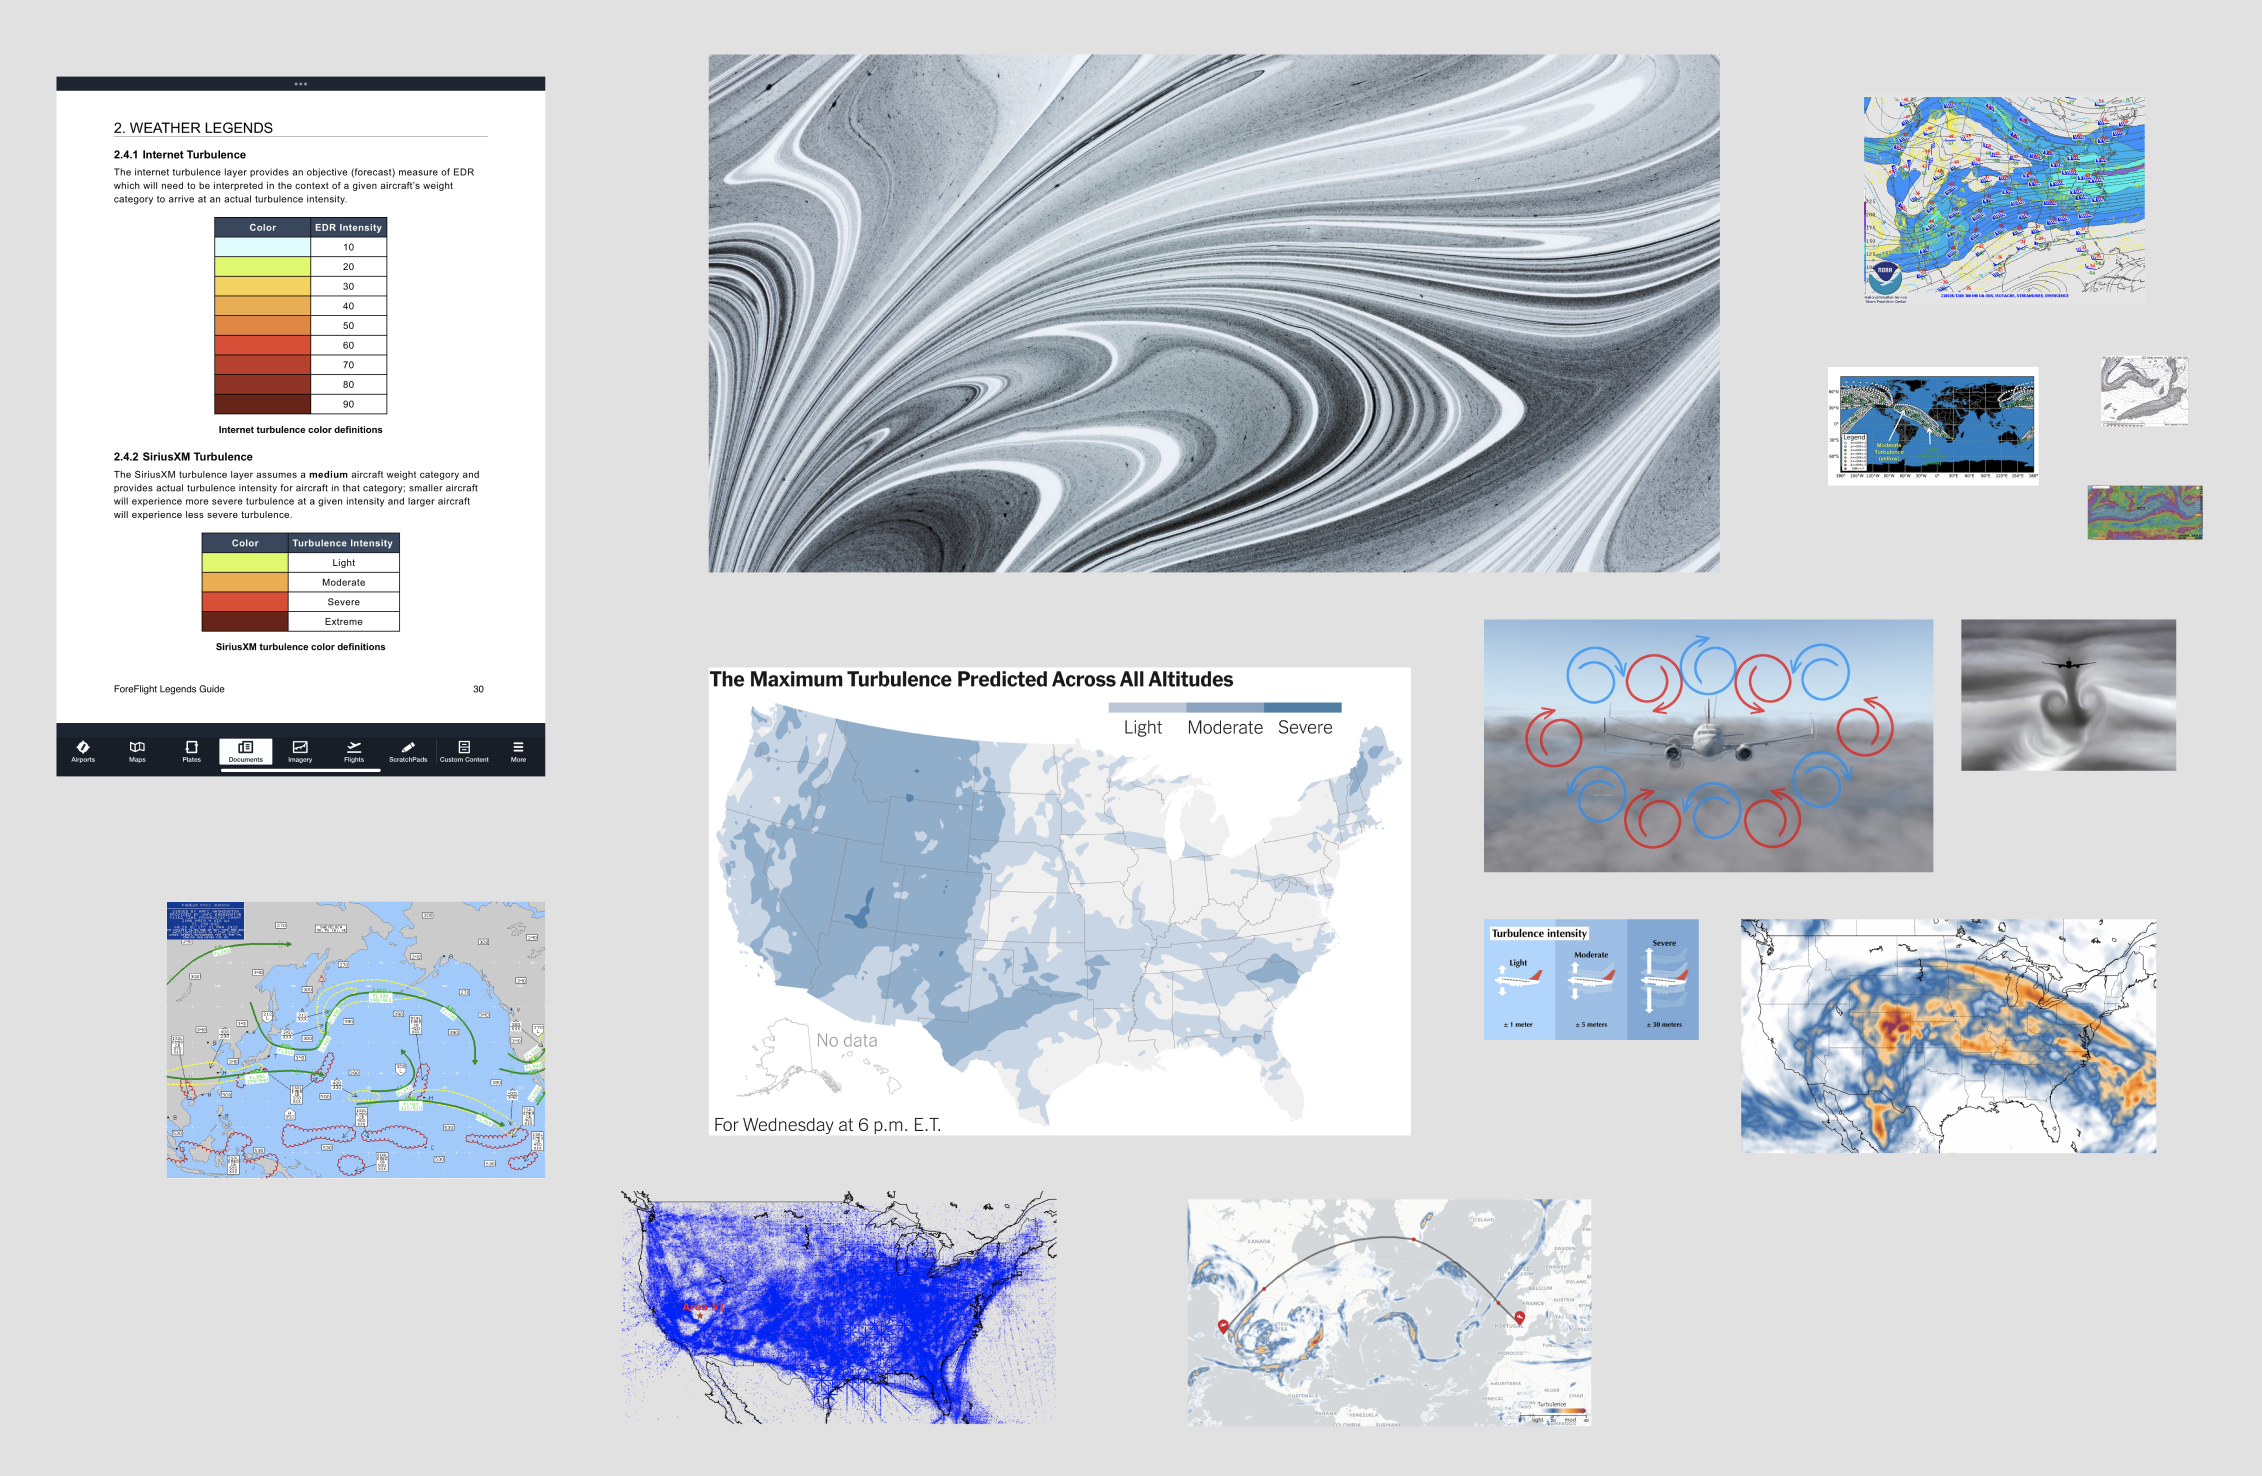
Once I has a handle on what the problem was, I immediately immersed myself in understanding turbulence- the causes, the tracking of it in other apps and the levels reported and what those meant.
I met with the Flight Deck Pro team, who had just built a similar feature in their application to identify and uncover any potential roadblocks ahead.
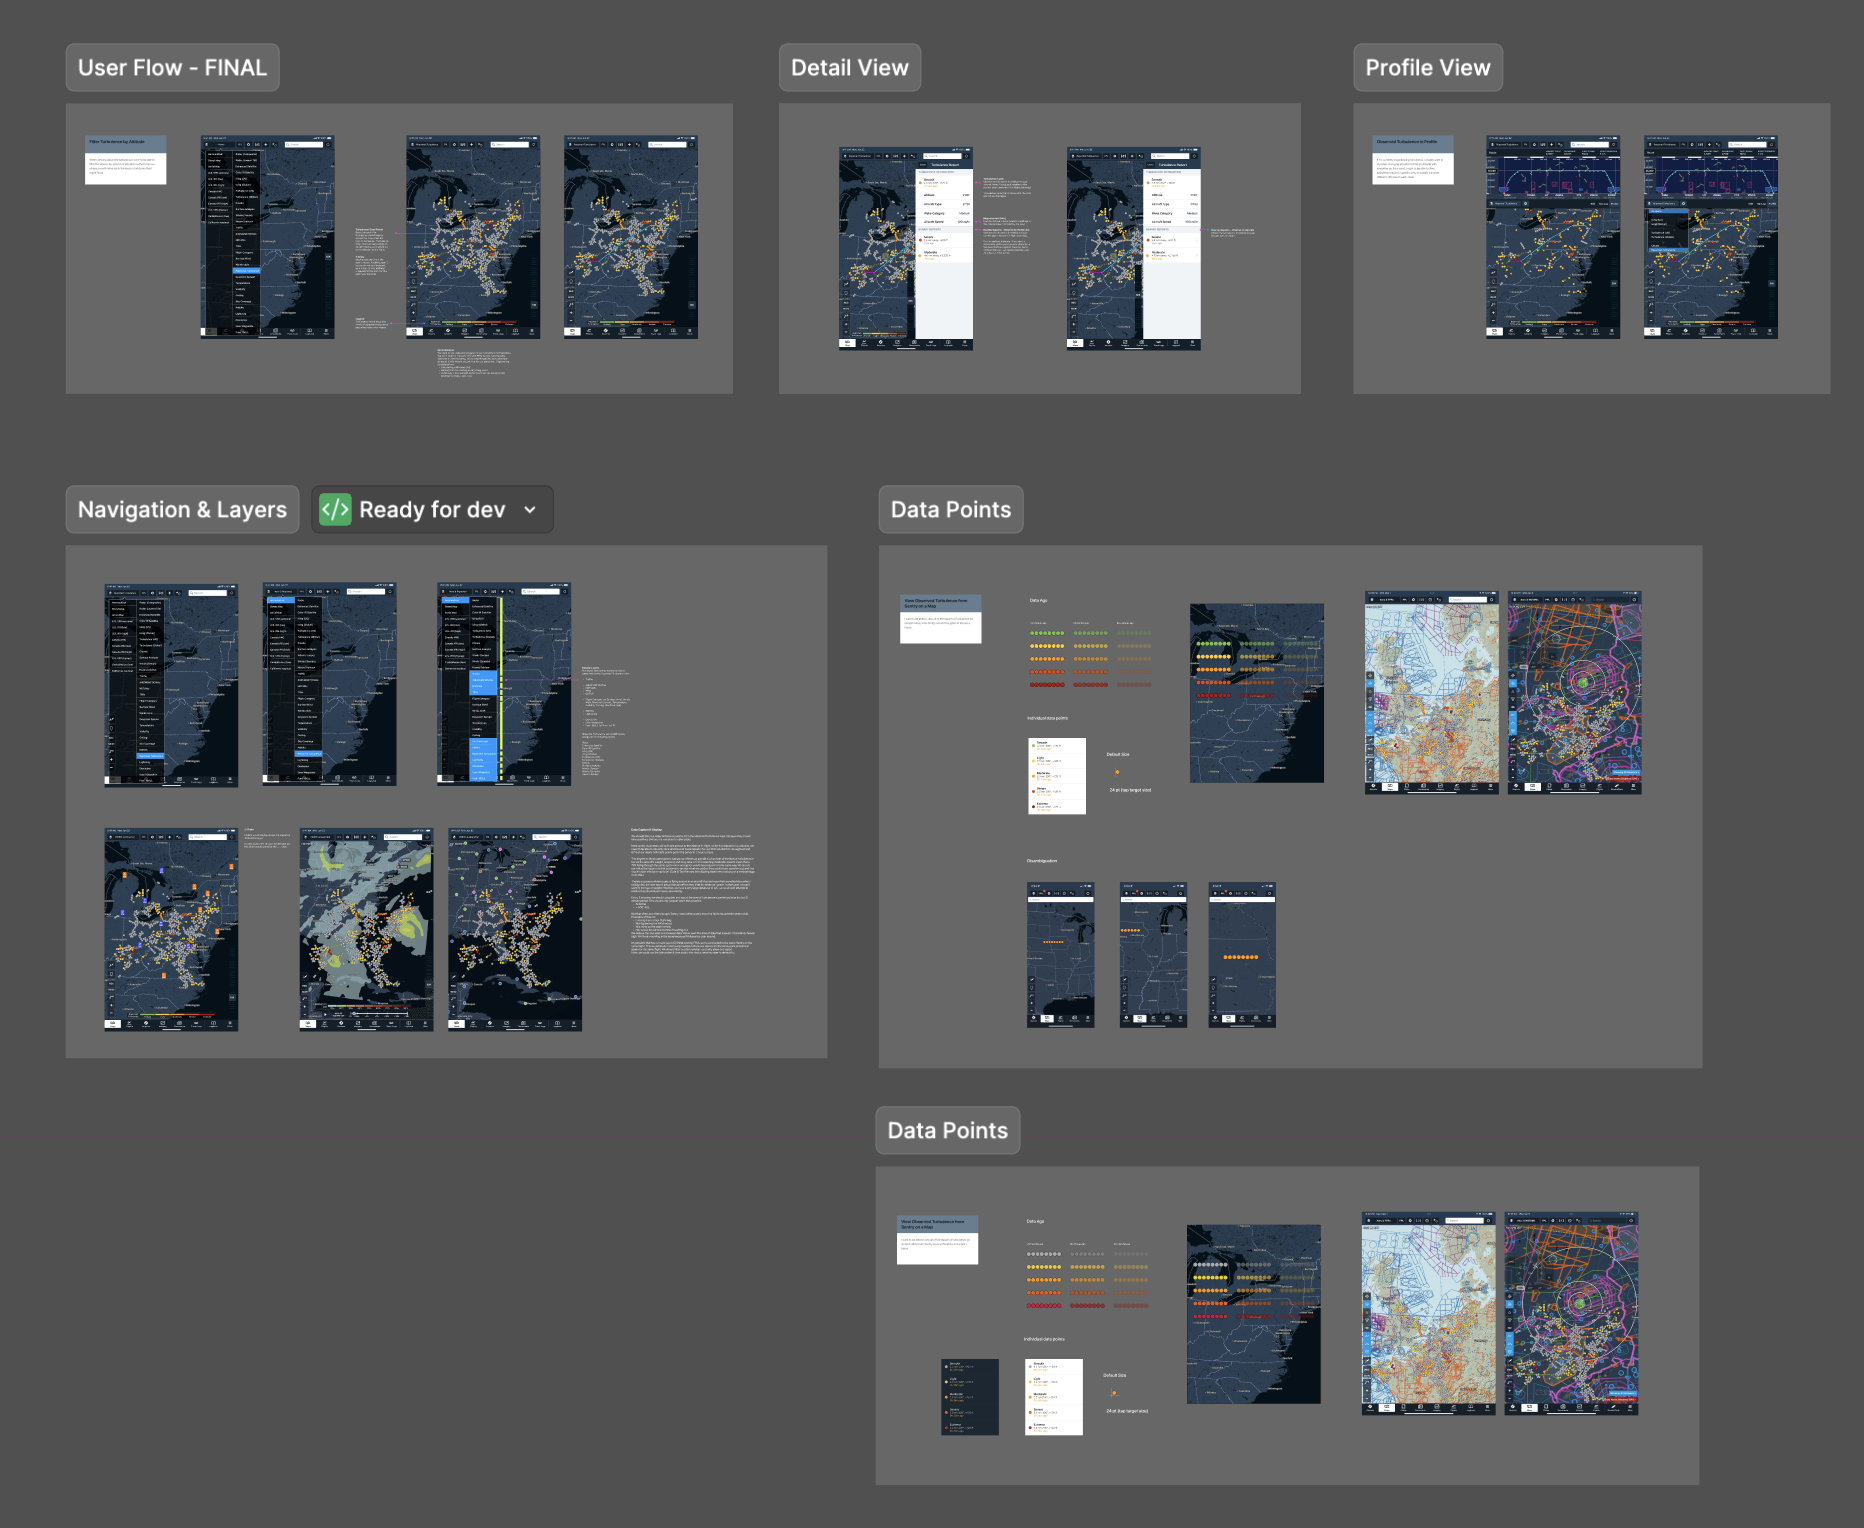
Design Iterations
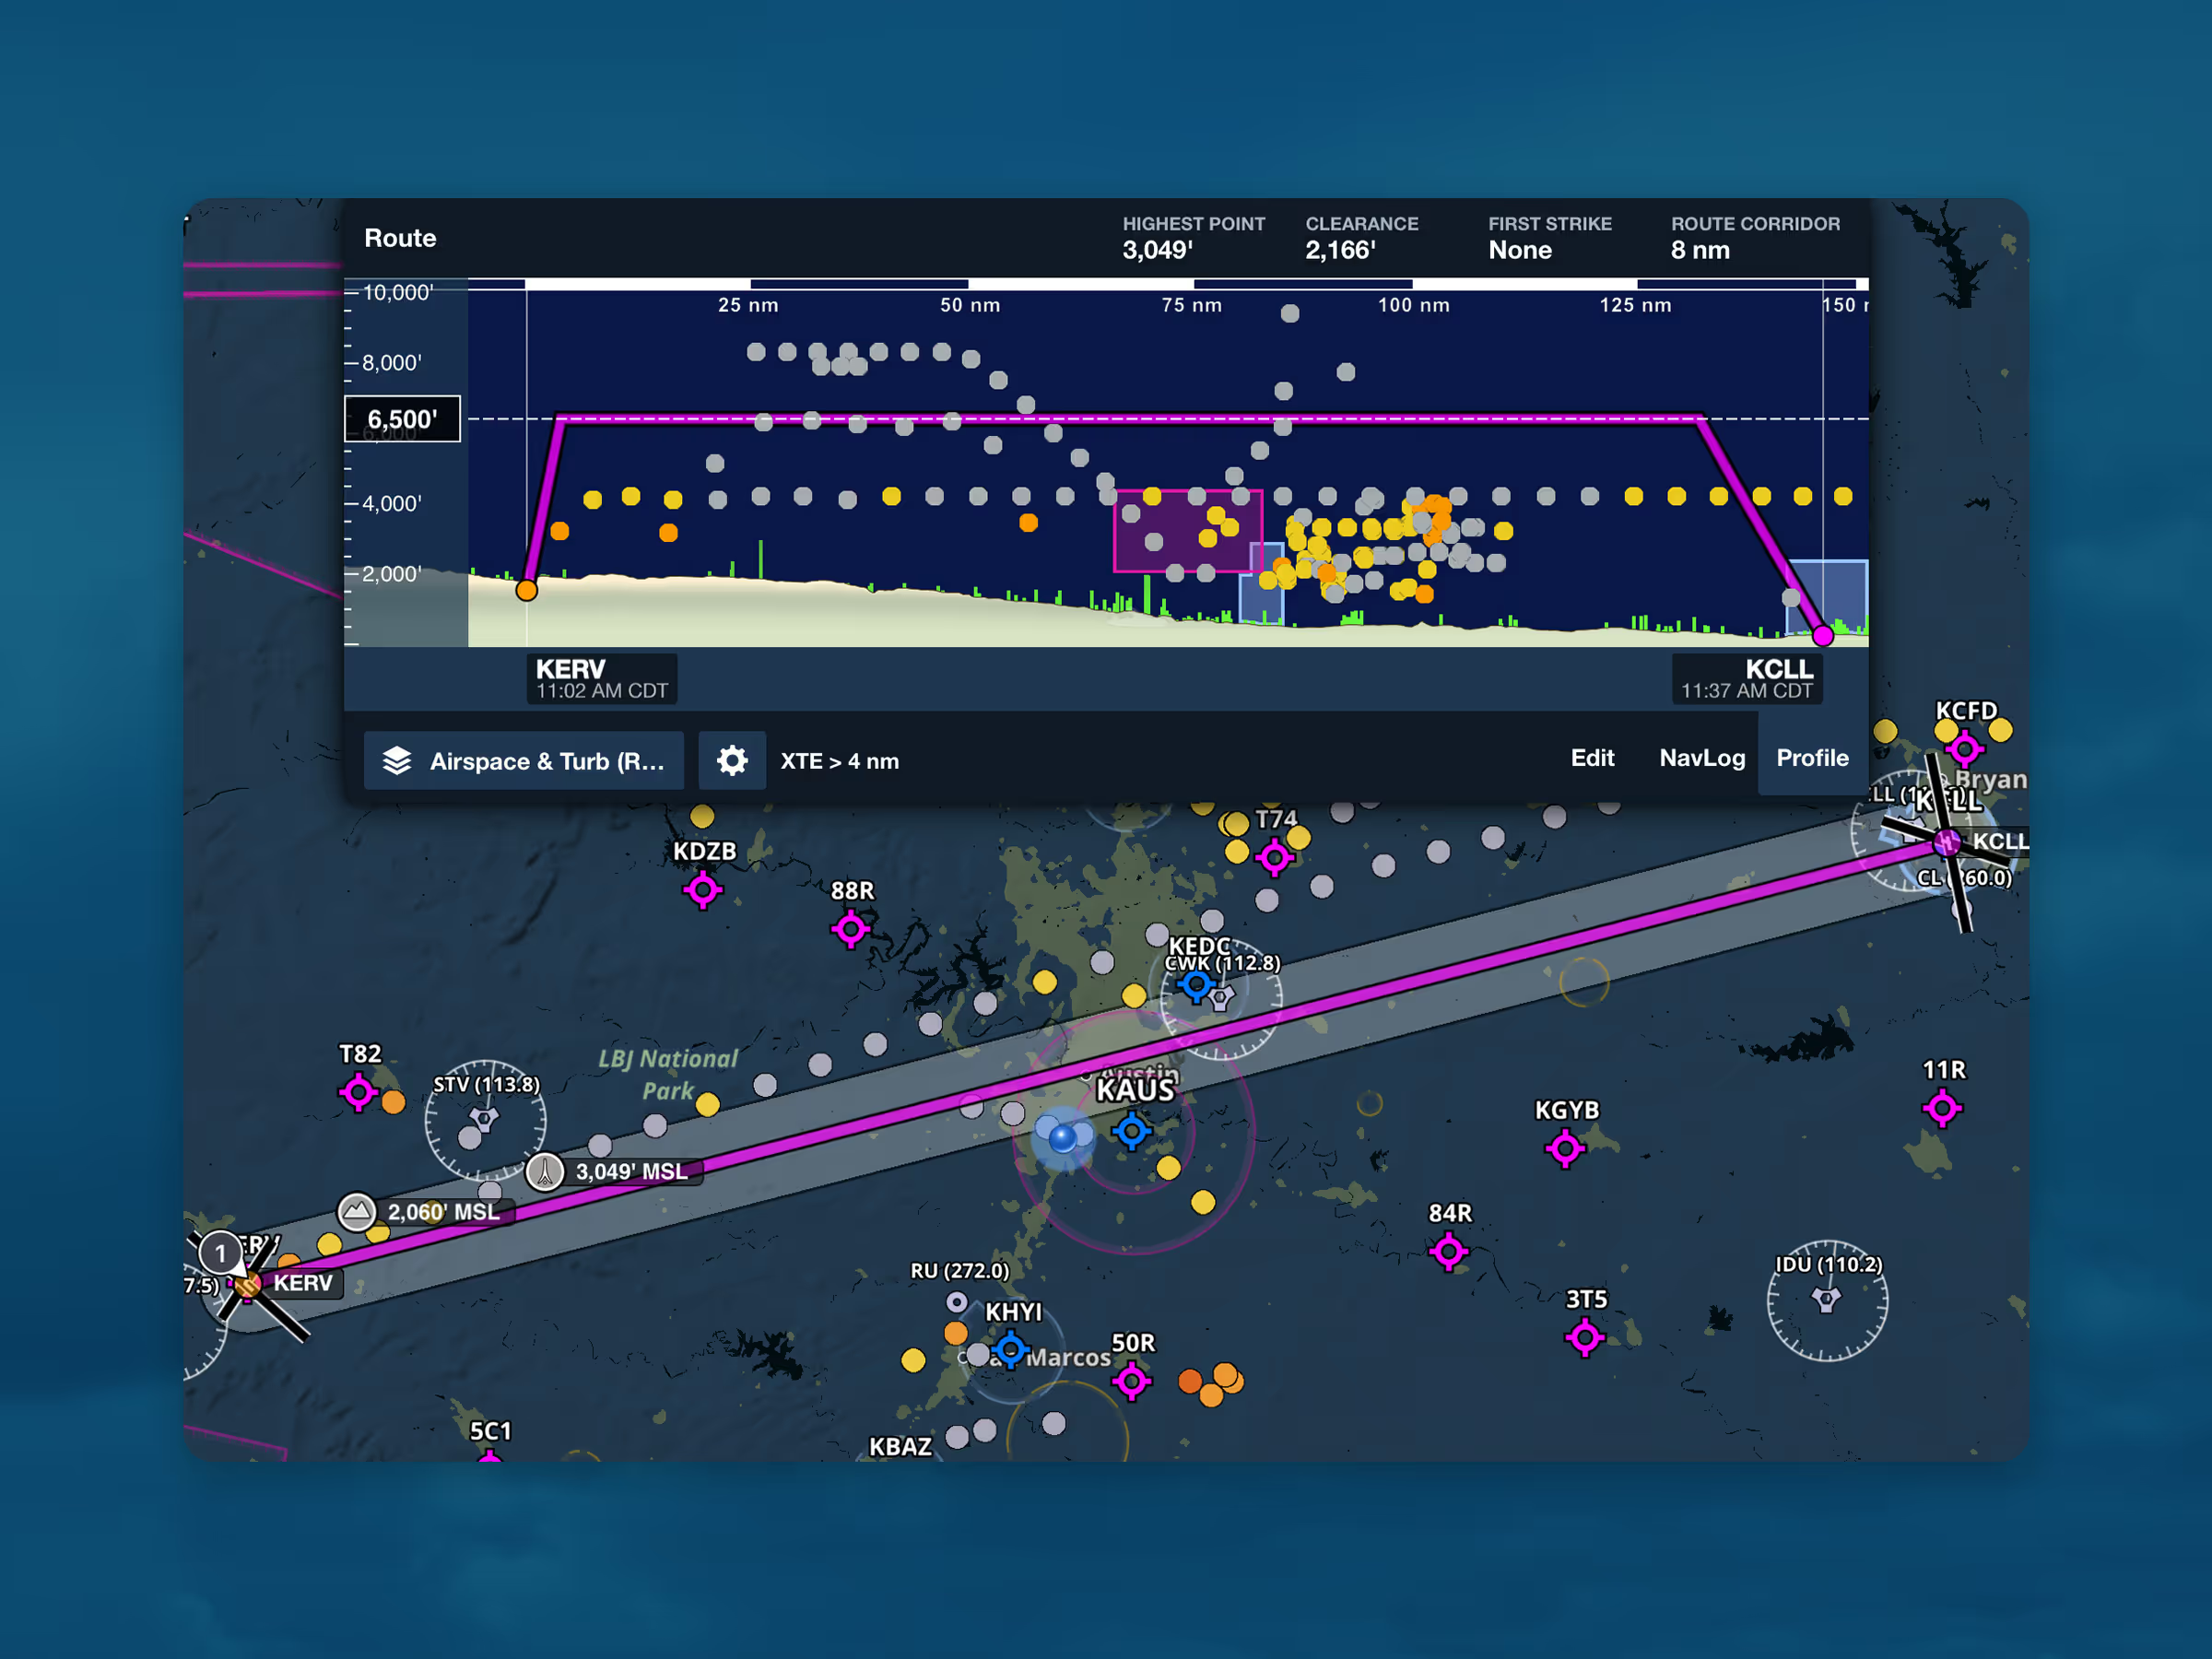
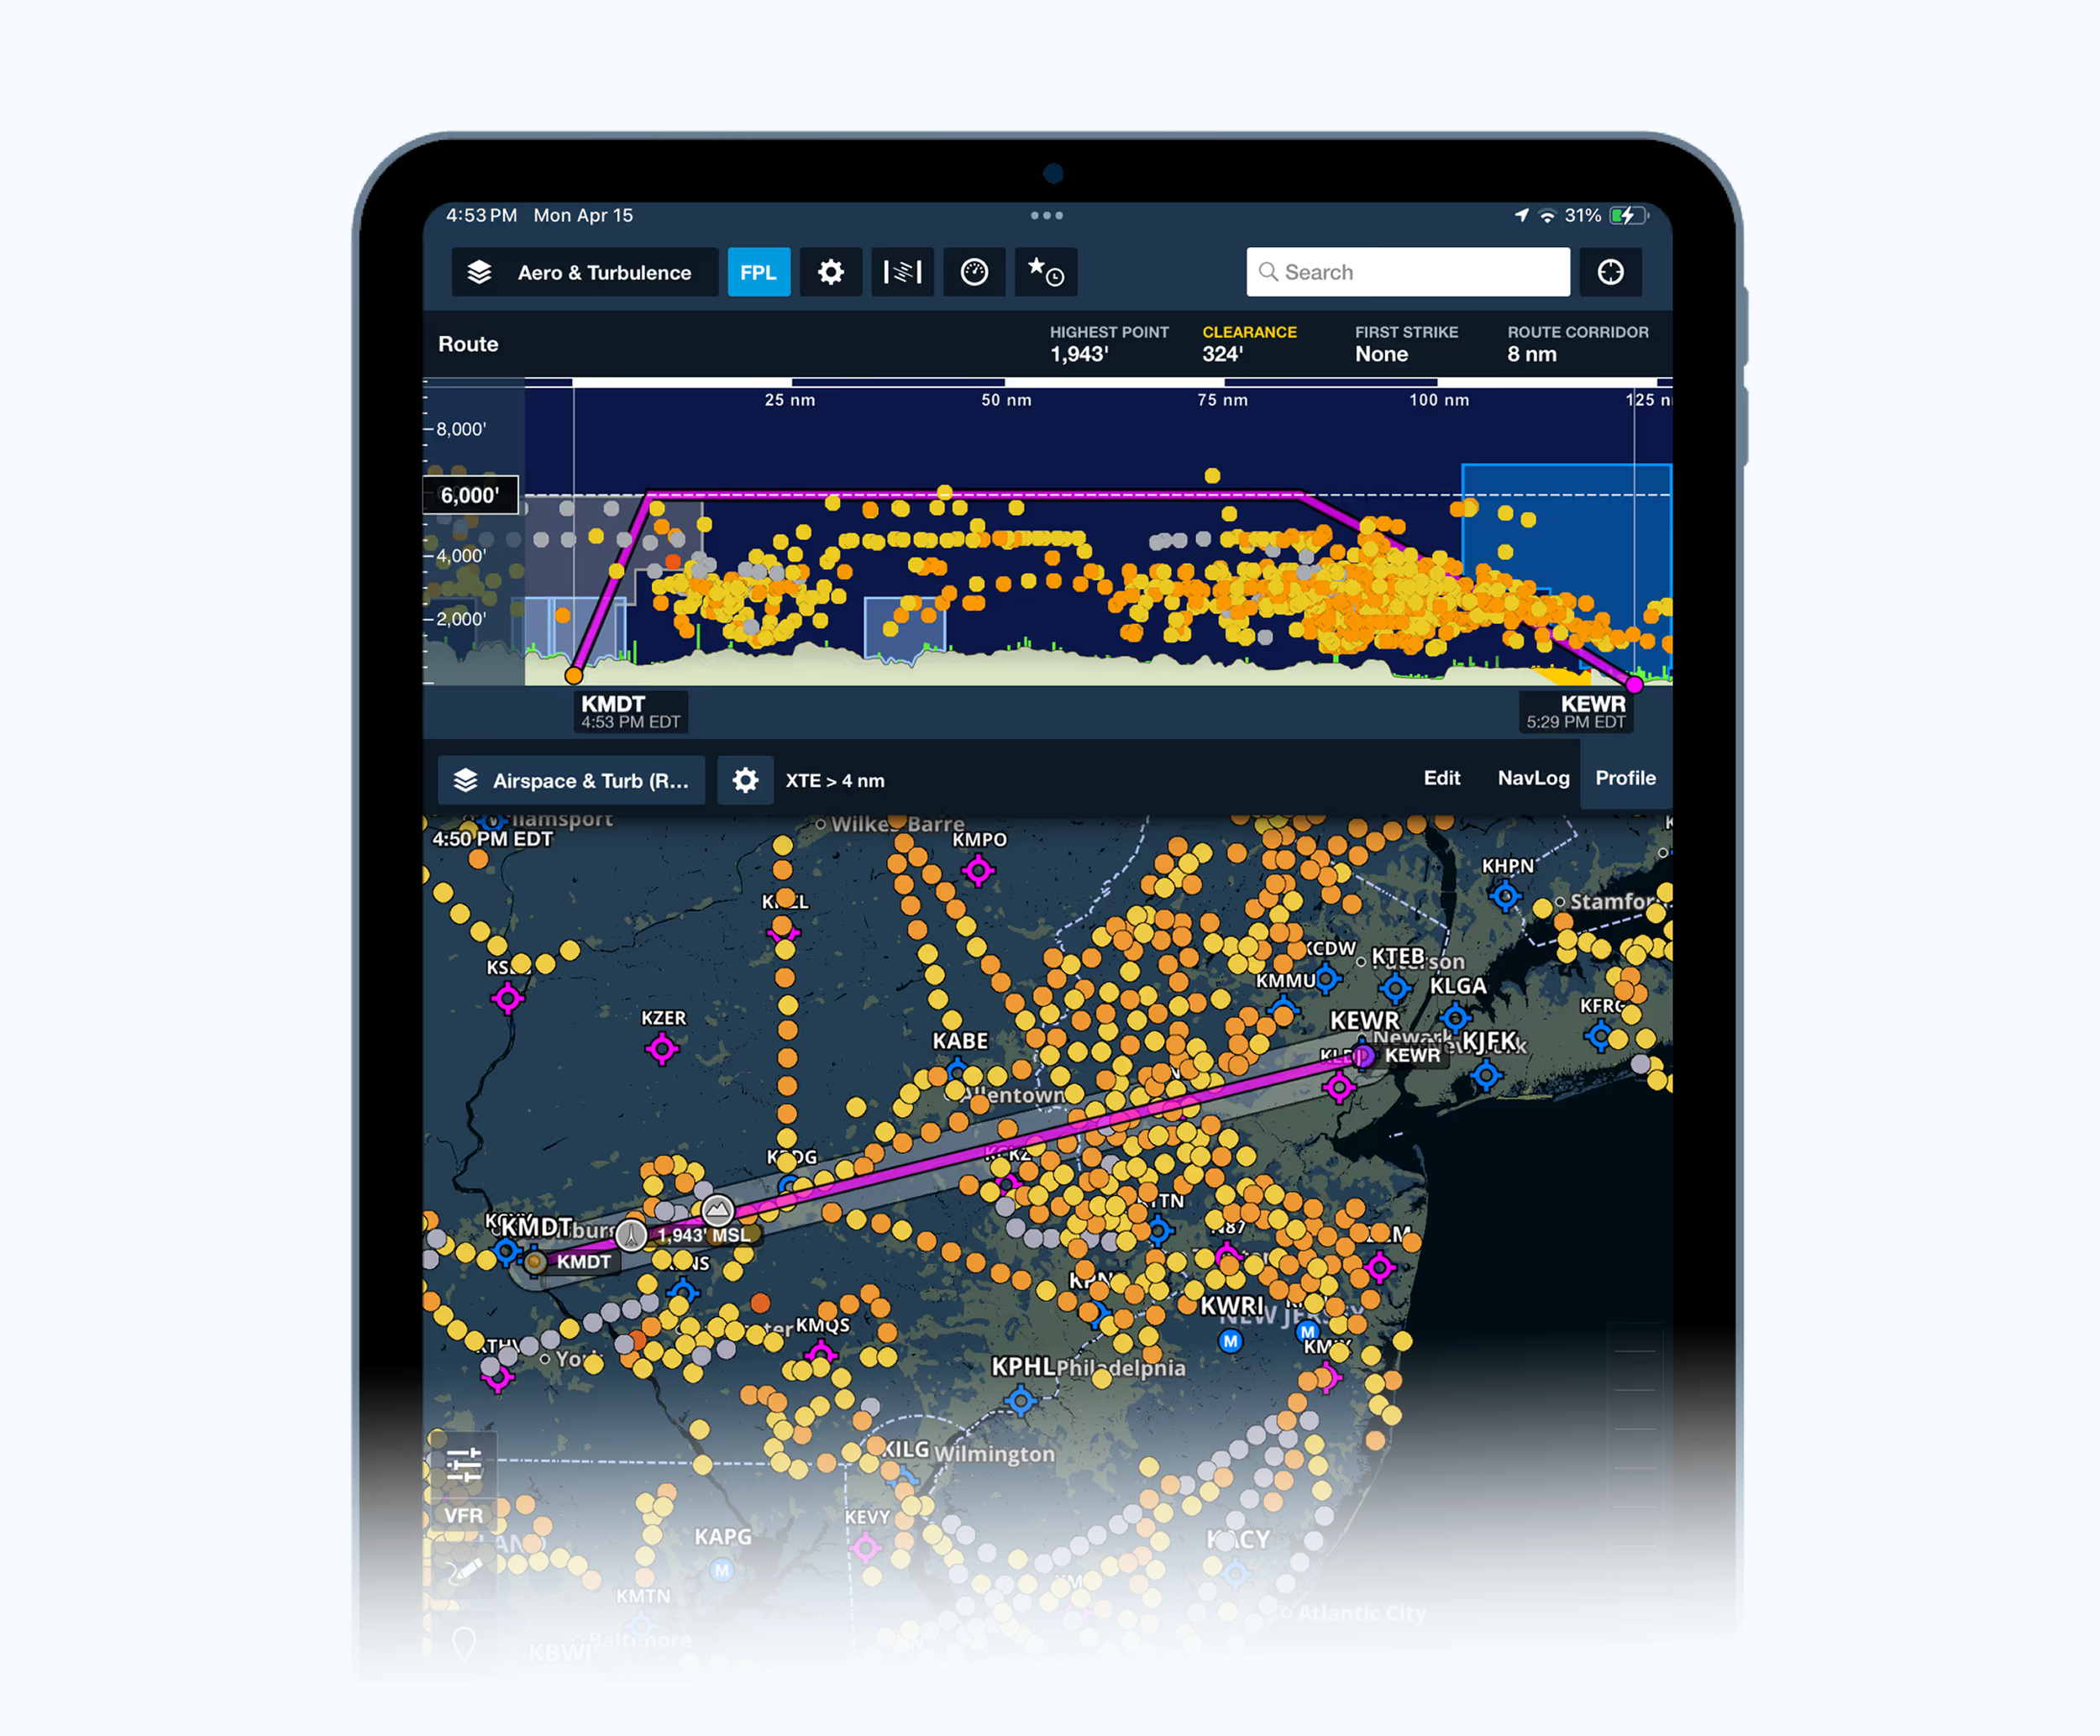
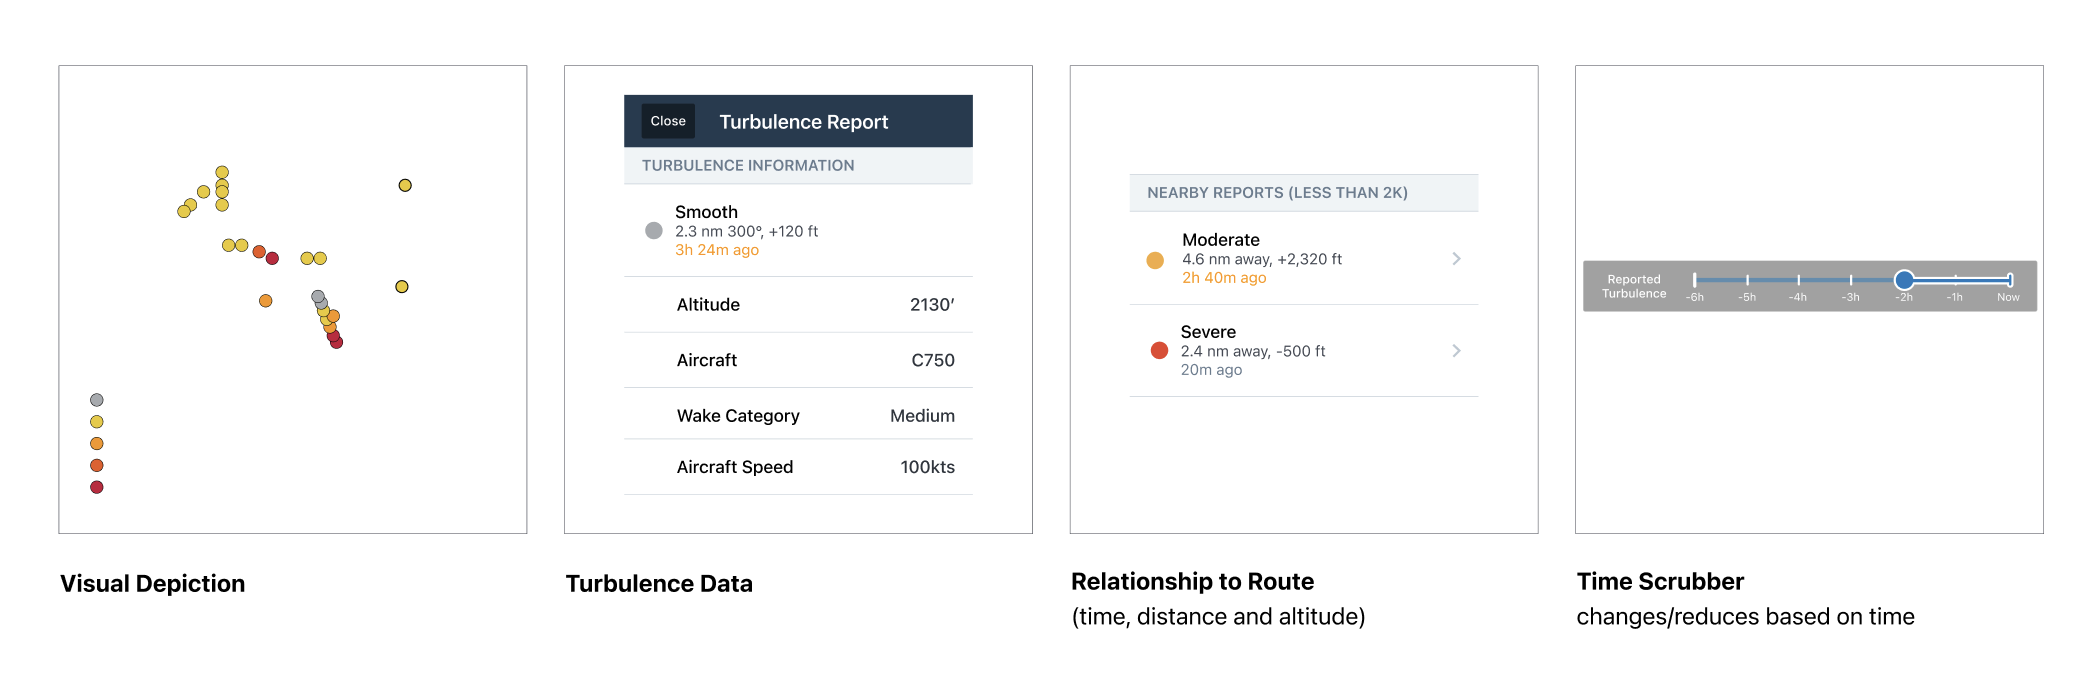
The display of the turbulence data had many iterations. I was trying to find a good representation that could be viewed on multiple map layers, and across both top view and profile view.
There were considerations such as the age of the data, how long do we display it for, how many points to show across a stretch of and the size of the turbulence points we were displaying.
Usability Testing
I put together a usability testing group of 8 participants and evaluated the user experience across several points, specific to the feature: altitude slider, time slider, corridor, map layers navigation, permissions, data and the data point detail.
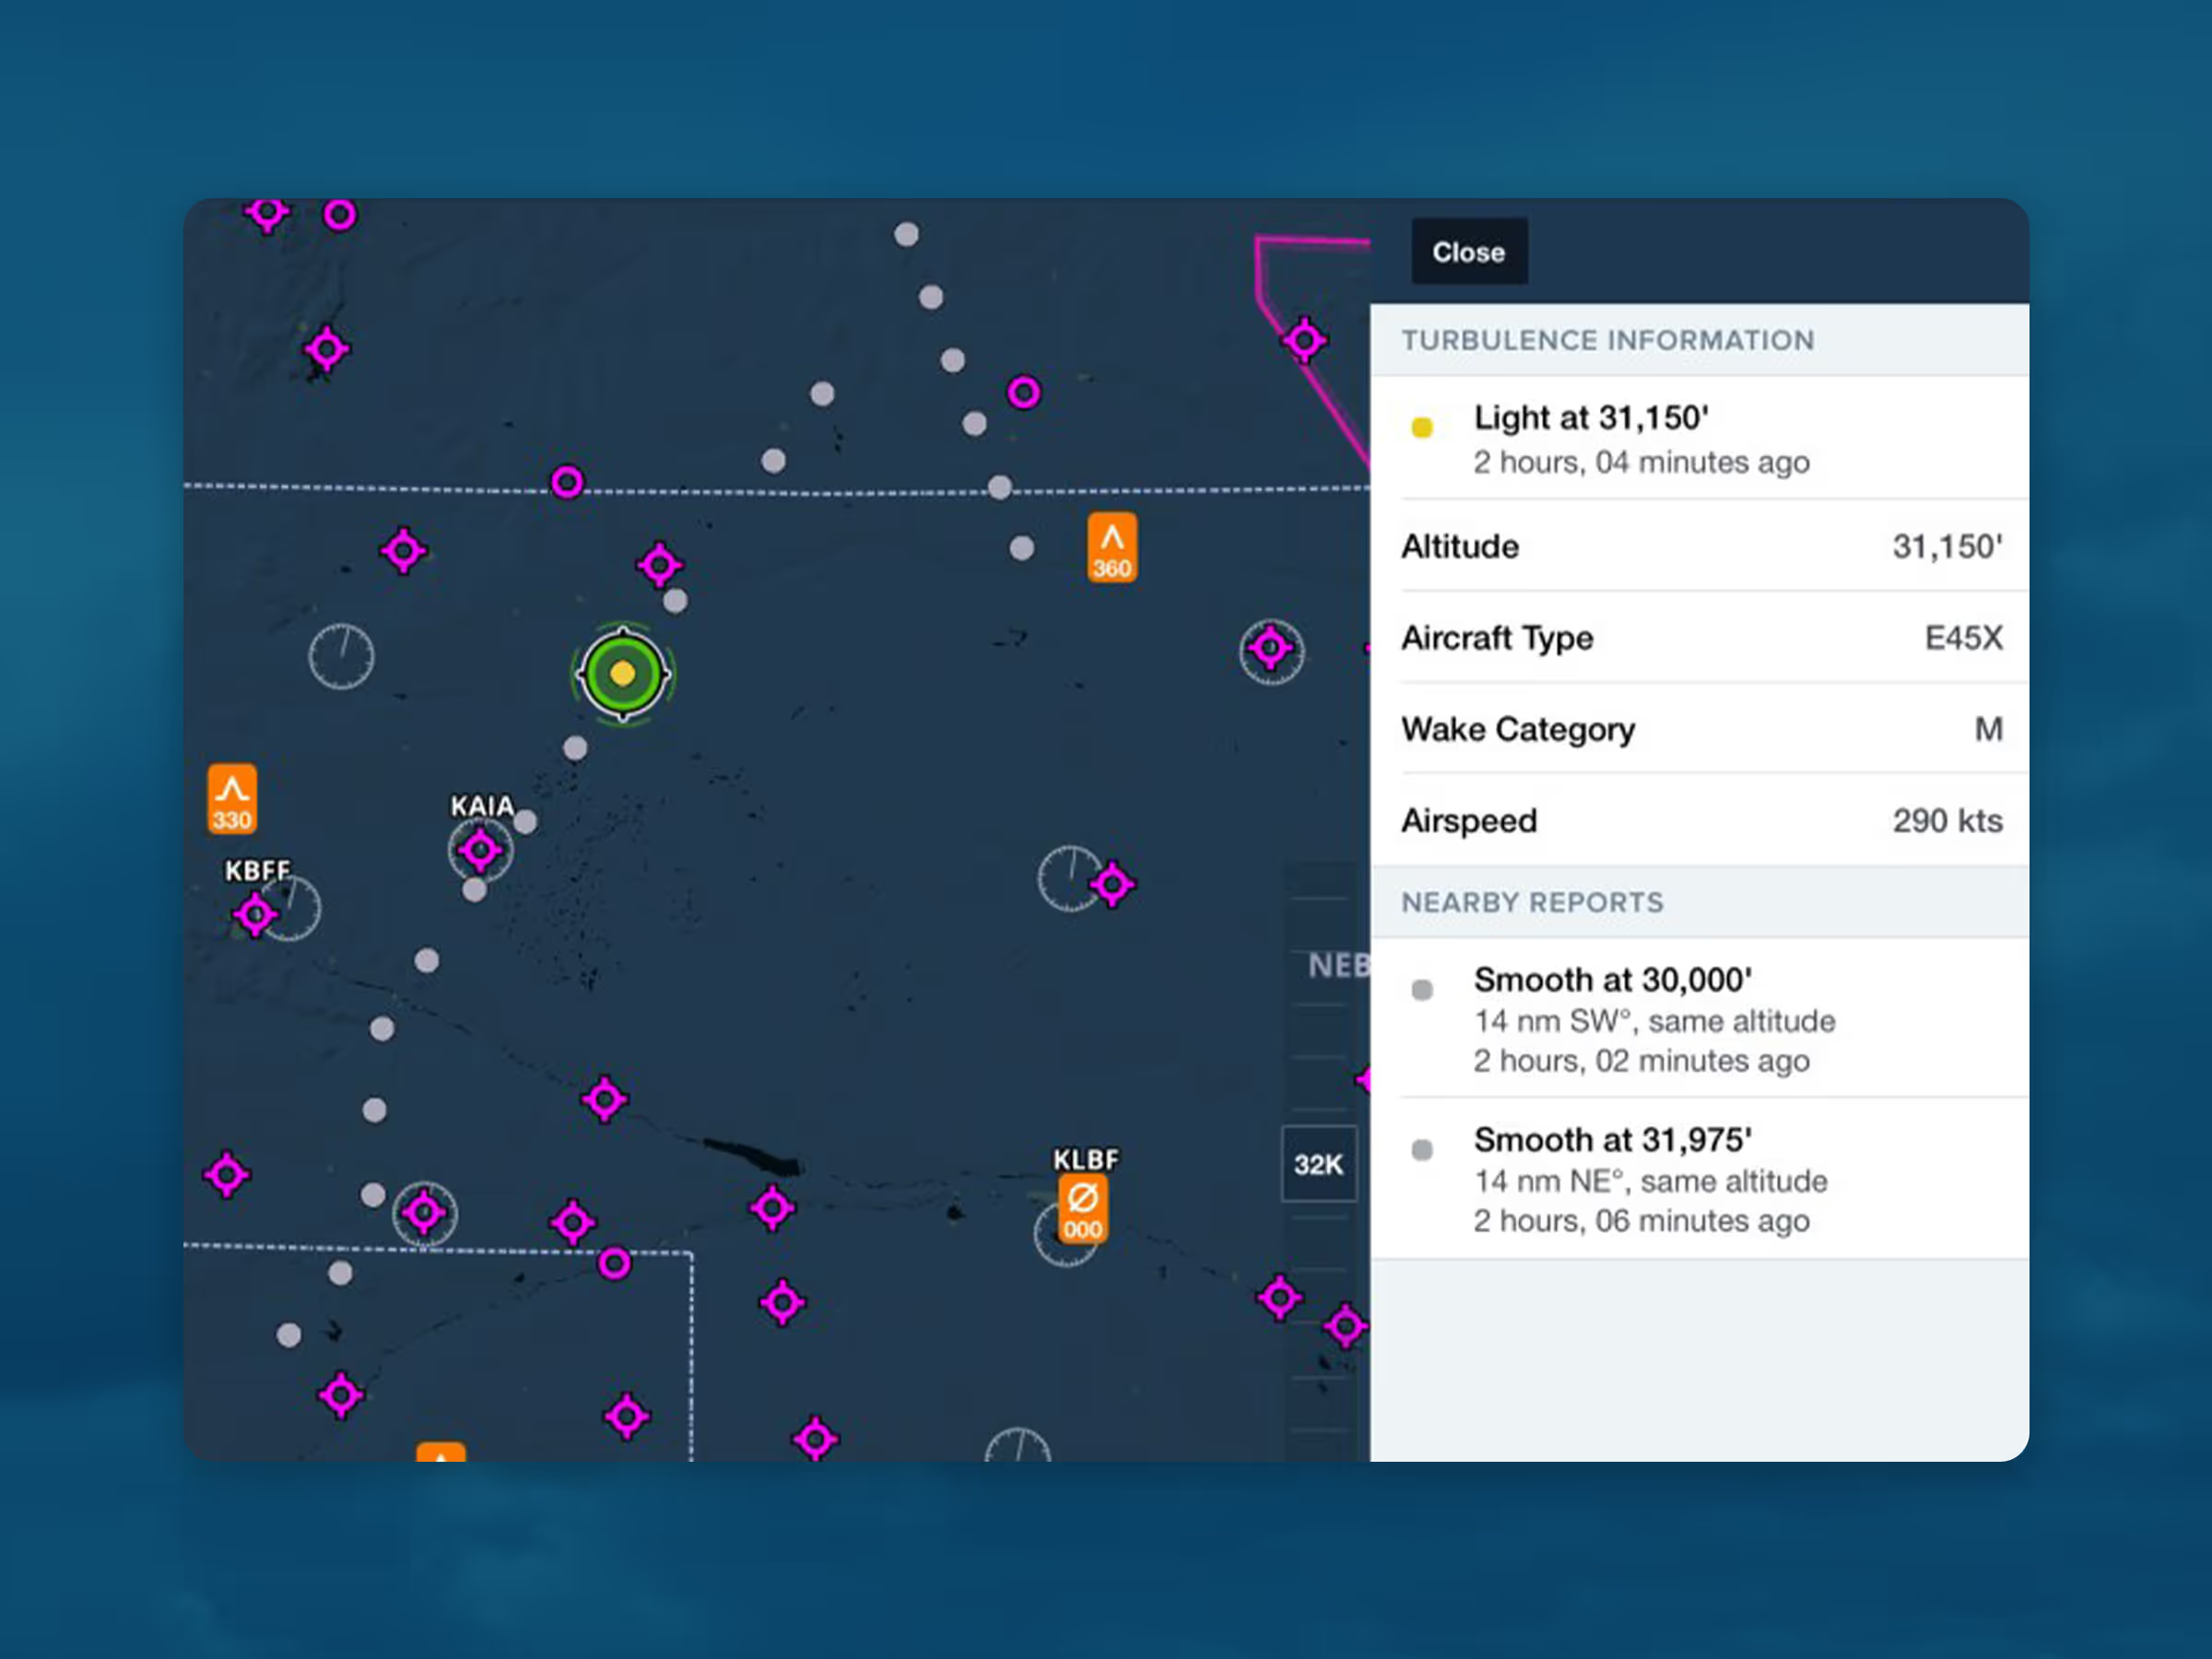
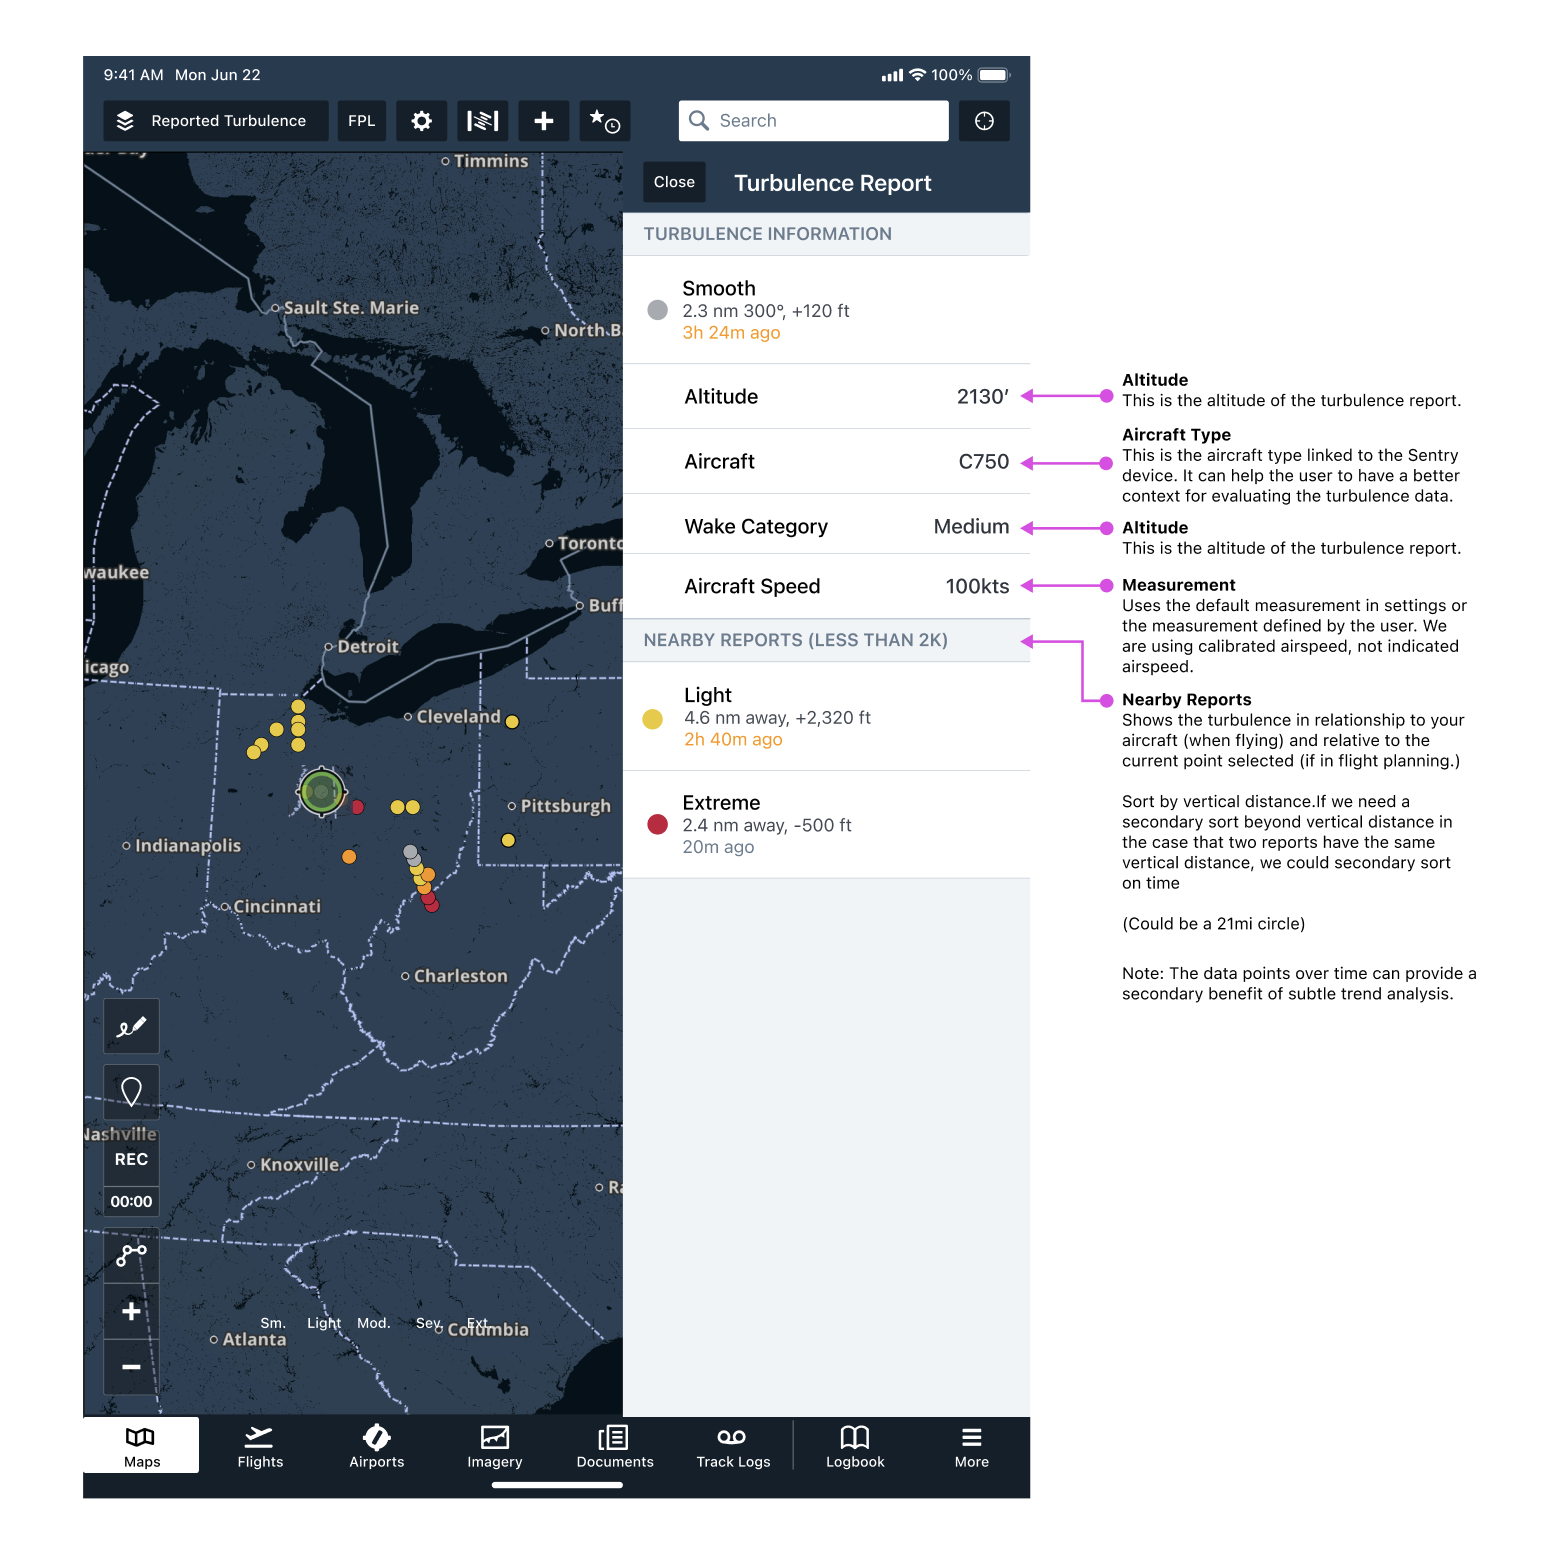
Interesting findings were surrounding the aircraft type, to provide more context to the data (since turbulence feels much different in a Boeing 747 than in a Cessna 172) and the permissions- since we are using this information from a Sentry device, can the users opt out of contributing to the sharing of data from their device.
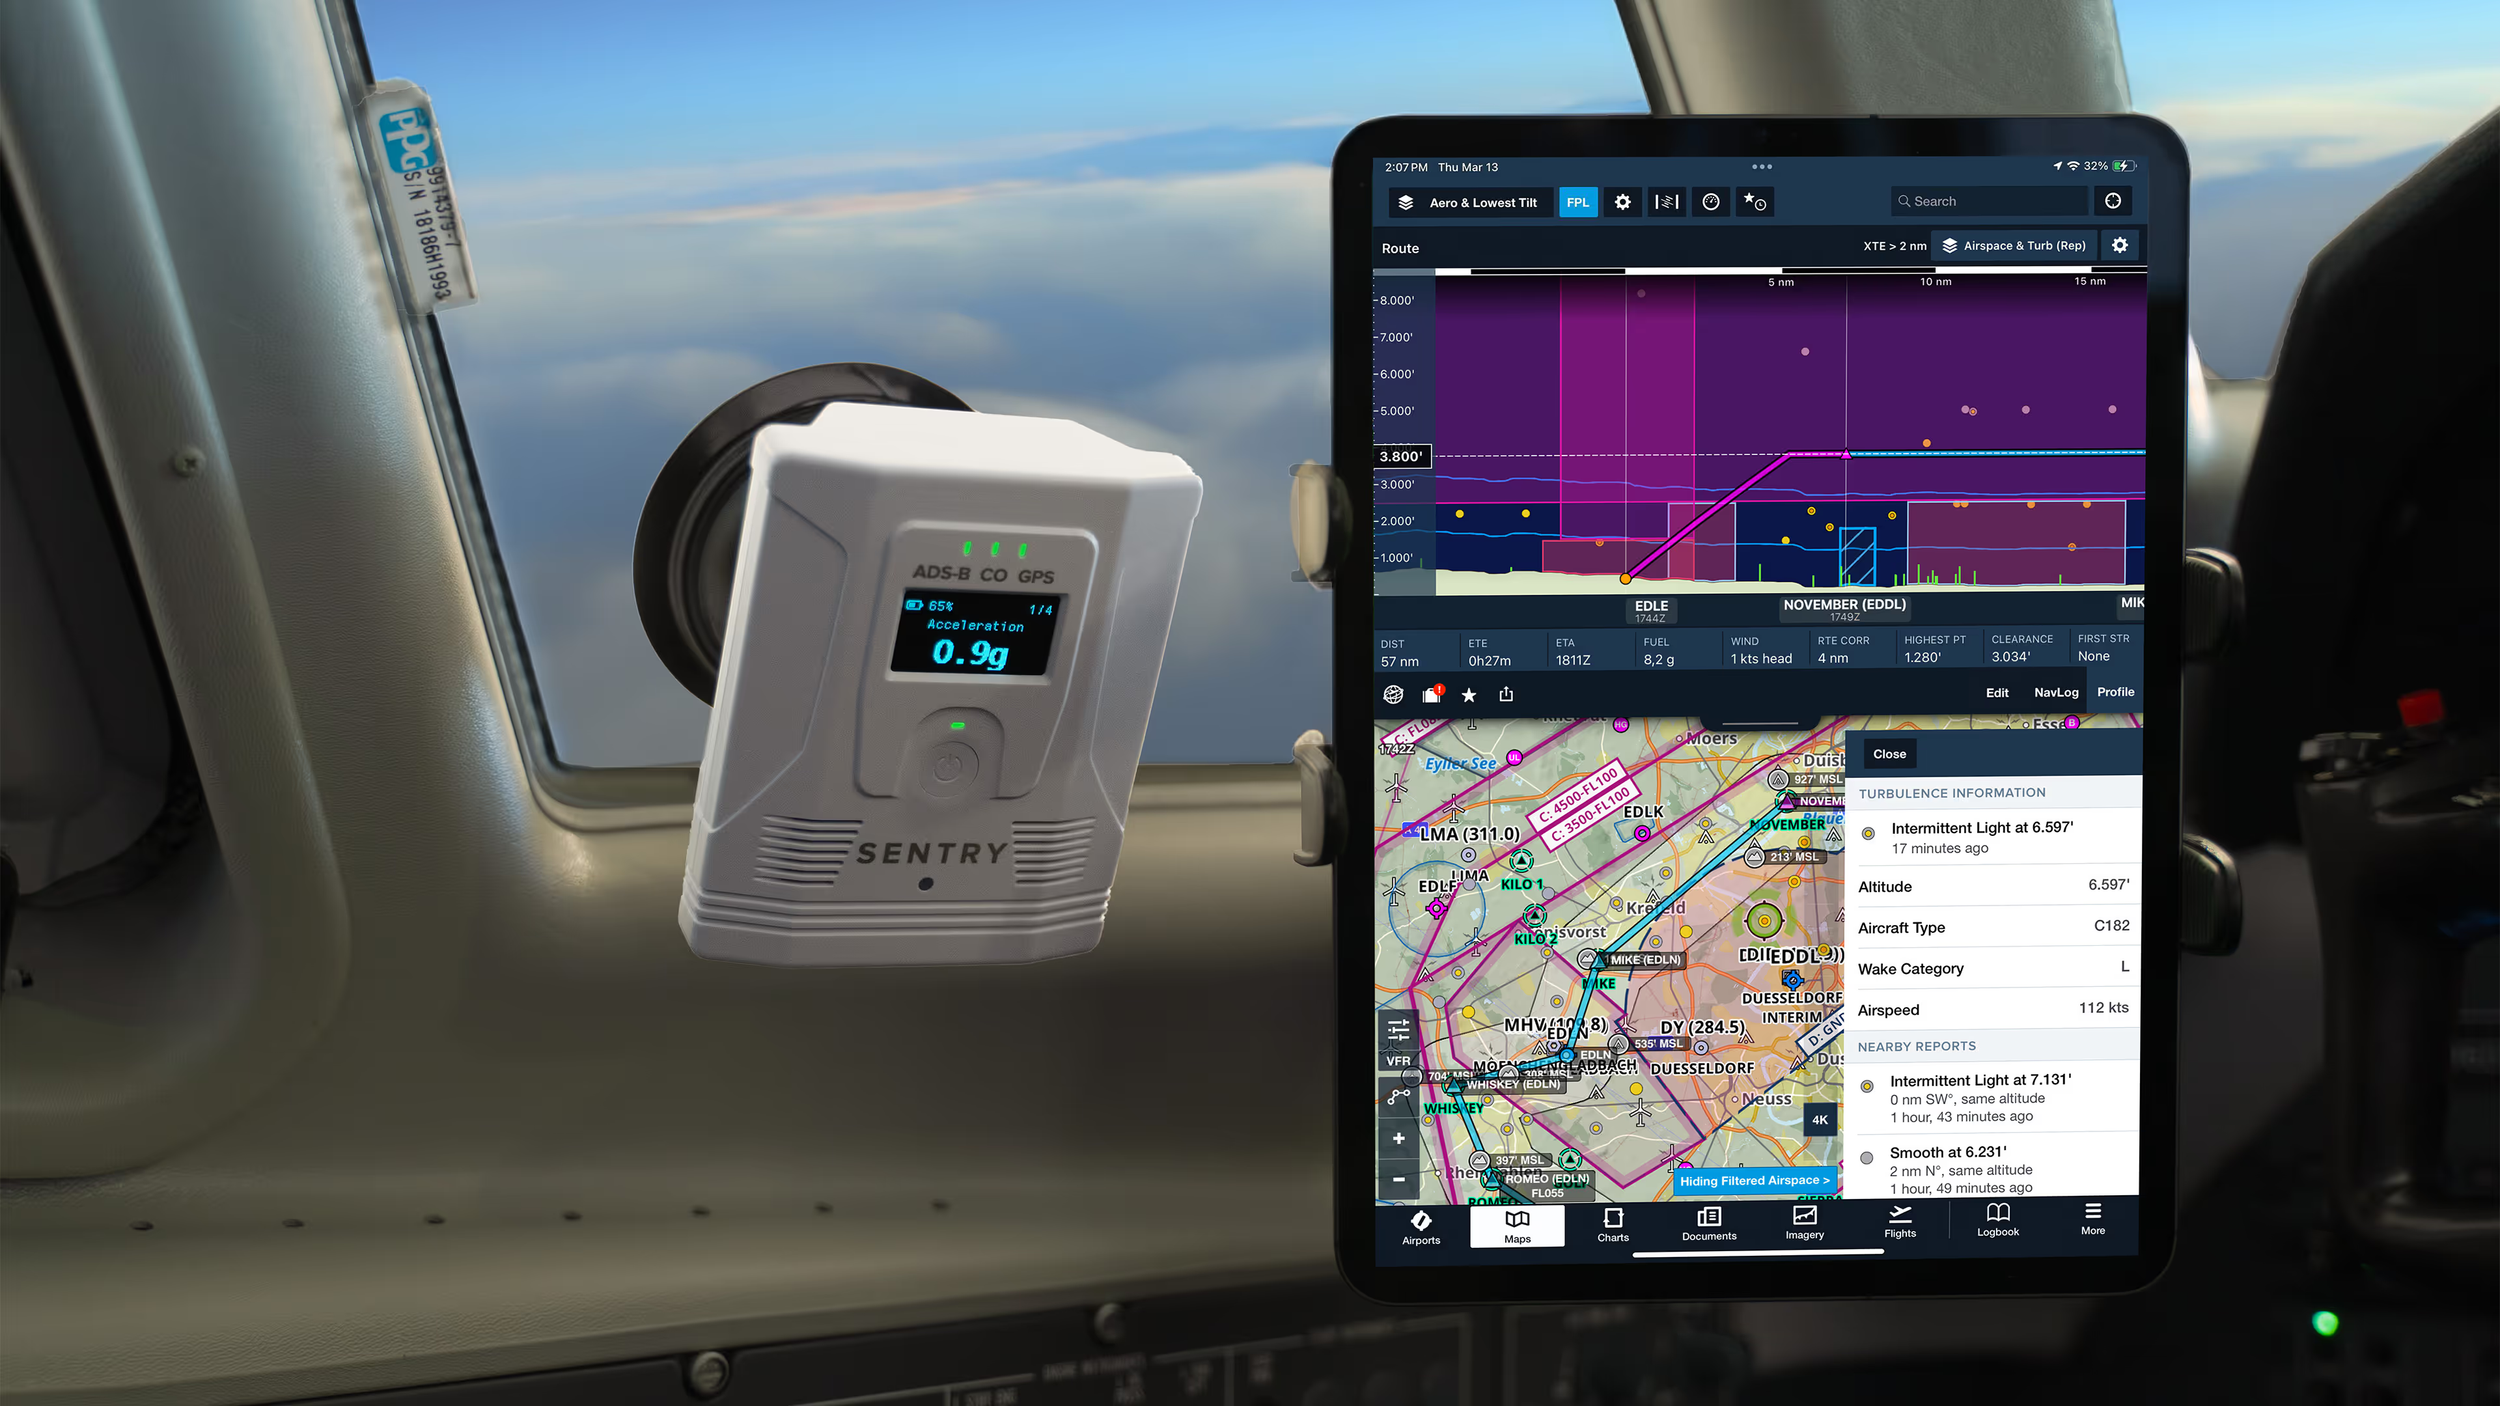
How It Works
The ForeFlight Sentry and SentryPlus receivers are equipped with several sensors that measure turbulence in addition to their other functions, using a unique algorithm developed in-house. The sensors detect, classify, and automatically save ride-quality reports, circumventing the subjective nature of manually submitting PIREPs. Reports are saved every two minutes, giving a high degree of accuracy.
The algorithm for Reported Turbulence takes the data from Sentry’s accelerometers, barometer, ADS-B antennas, GPS data and other input data. It’s carefully filtered to exclude any unreliable or erroneous information and the results give a detailed ride quality map layer.
Turbulence reports are classified into intensity categories: Smooth, Light, Moderate, Severe, and Extreme. They’re then uploaded to ForeFlight Mobile as soon as an internet connection is established after or even during a flight.